Pascal’s Triangle Fractals in Alteryx
by James Charnley
Background
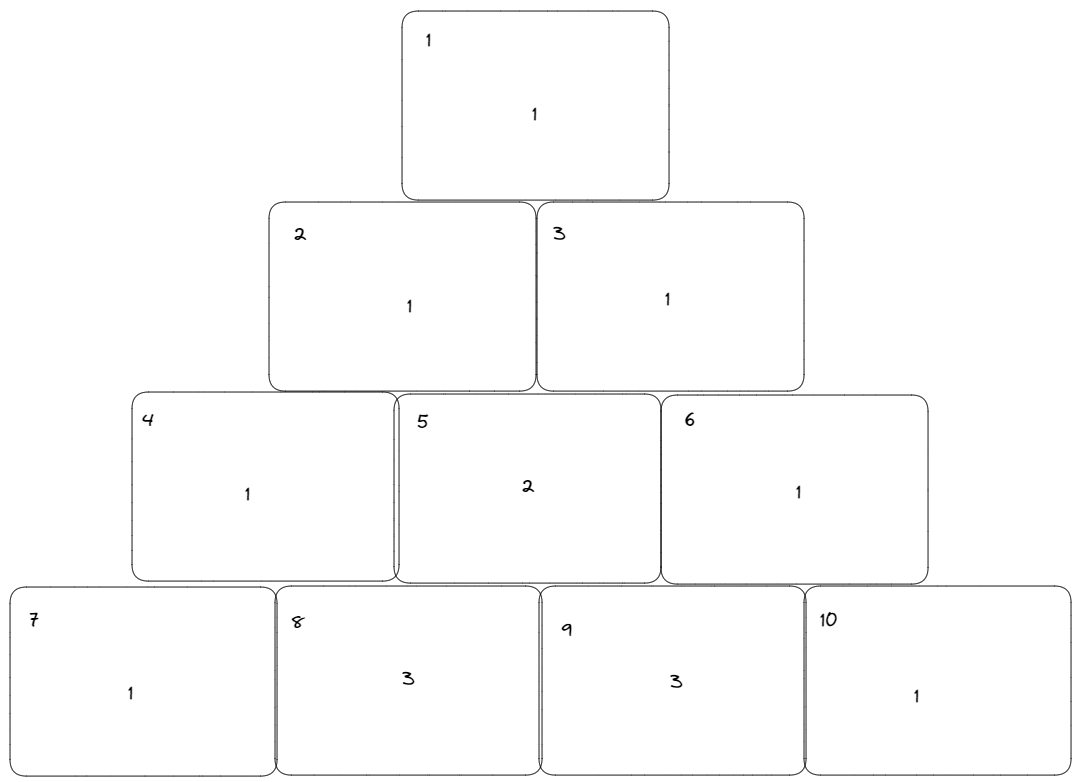
Google tells me that a Pascal's Triangle is a triangular array of the binomial coefficients that arises in probability theory, combinatorics and algebra. Put (in my opinion) normally, a Pascal's Triangle is made by summing the two adjacent numbers found in the preceding row. It looks something like this quick sketch below:

What most people don’t know is that when highlighting values within a Pascal's triangle that are all divisible by a given number, triangle fractals are produced. For example, a Sierpinski Triangle is created when highlighting every number divisible by 2, as seen below:

As soon as I learned this, my goal became to build an Alteryx App that would allow a user to input a number, and the output would highlight all numbers in a Pascal’s Triangle divisible by that input.
Early considerations
I began to ponder the options I had in terms of what the final product would look like. If I wanted to conditionally colour certain values in a visual output, I was restricted to a table or a map. Thinking of the formatting hacks I’d need to be aligning a number in between the two numbers on the previous line in a table, I quickly settled on a map. That way, rather than one cell in my triangle being a cell in a table, I could make each cell a polygon, and use lats/longs to align them perfectly.
The next thing to think about was how I would need the data to look. If we have one square polygon as one row of data, if we can create another column that’s one row per value in Pascal’s Triangle (both structured top to bottom left to right), we’d be able to join them together on record position to give each polygon its requisite value. At this point, I assumed the size of our triangle would be decided by how many rows can be made before our Pascal’s Value can’t fit in an Int64 (I was wrong for multiple reasons to be discovered later).

The Triangle
The basic idea behind building the triangle is that we can start with the single square in the first row, and build an iterative process that continues to construct the squares in the next row for as many iterations as we desire. Our first square can be built from points that have arbitrary lats and longs like so:

We want two things from our macro, and therefore want two macro outputs. It needs to actually build and output the square, but also have an iterative output with the same schema as our input, with the next row’s coordinates. When finding these coordinates, I found it easiest to split my flow into three:
Finding the points that will lie outside our previous leftmost square.
Finding the points that will lie outside our previous rightmost square.
Finding the points that are at the exact midpoint of the square above it. Each of these points will need to be duplicated so they can be used to build two squares.
Because I’ve given my square an effective length of 0.1 degrees, I can use a fixed value of 0.05 when calculating both latitude and longitude to find my new coordinates. At this point, the workflow looks something like this:

Now that all of the coordinates have been found, they need to be grouped together accurately in order to build the correct shapes during the next iteration. Since we want to order our triangles left to right, I eventually managed to do this by sorting by the newly calculated longitude ascending, with my duplicated point order also ascending, allowing me to tag the correct groups of four.

The final part of the macro establishes the necessary sort order to isolate the correct points when the workflow was split into three previously. It would be possible to find a more efficient way to isolate the points earlier in the macro and remove this step, but since this works fine and I’m scared to break it, it’s staying. One thing to note is that because the sort order is vital during each iteration, this particular macro will only work in a workflow if AMP is turned off, and the sort logic would need to be different if AMP was on.
The final macro:

An example of the triangle built with 128 iterations:

Calculating the Pascal’s Values
I thought that calculating the values for the Pascal’s triangle was going to be a quick job to wrap up once the triangle was built, but I was wrong. The logic of my first macro attempt was straightforward, and seemed to work at first.

The idea is to just use a multi-row formula to add each adjacent pair of values, and then union on a static value of 1 to each side of each iteration. It became obvious that something was wrong when I joined the values to my triangle and made my first map:

The pattern is apparent at the top of the triangle, but falls apart way before our expected cap of ~64 rows. After counting, I realised it was happening during the 34th iteration:


The macro is just simply unable to sum two 10 digit values. I found a post on the Alteryx forums from a user who wrote that their Pascal’s triangle macro also tripped up at this point due to overflow issues, so I began to look for ways around the issue. I began to look into the idea of a long addition macro for strings, or the binomial theorem, but before going too deep down this rabbit hole I had a thought: If this was going to get tripped up around 64 iterations anyway, why not take a new angle entirely and look for another way to find out which cells to highlight.
I enlisted the help of a friend, Toby, who studied Maths and explained my challenge, and he quickly gave me the good news:
a mod x + b mod x = (a+b) mod x
Now I’d be lying if I said I understood on the spot how my problems were suddenly fixed, but you don’t need to understand the proof to get the general idea. It’s not necessary to check if the actual Pascal’s value is divisible by X, because every iteration we can instead sum the results of a mod calculation from the previous row to see if the value that would be in that cell is divisible by X. This way, the numbers being carried over are never going to be bigger than the value we enter into our app, so we’ll never have any overflow or size issues.
This actually meant only a small change to the macro we built before:

The Final Steps
Now that both macros are working as intended, the squares that make up the triangle just need to be joined to our boolean flag that indicates whether or not it needs to be coloured. The map then just needs a Thematic Field of the mod flag, and we can output a correctly coloured triangle.

An interface tool can update the values in the mod calculations, and our app is completed! I’ve included some of my favourite example outputs to round out the blog:


